


Solutions
Southeast Asia M&A in 2Q2026: Where Deal Activity is Concentrating

This article highlights key findings from Speeda’s “SEA M&A 2Q2026” report. For the full analysis—including country and sector breakdowns, top M&A transactions, startup financing trends, and additional deal-level insights—submit the form to download the complete report.
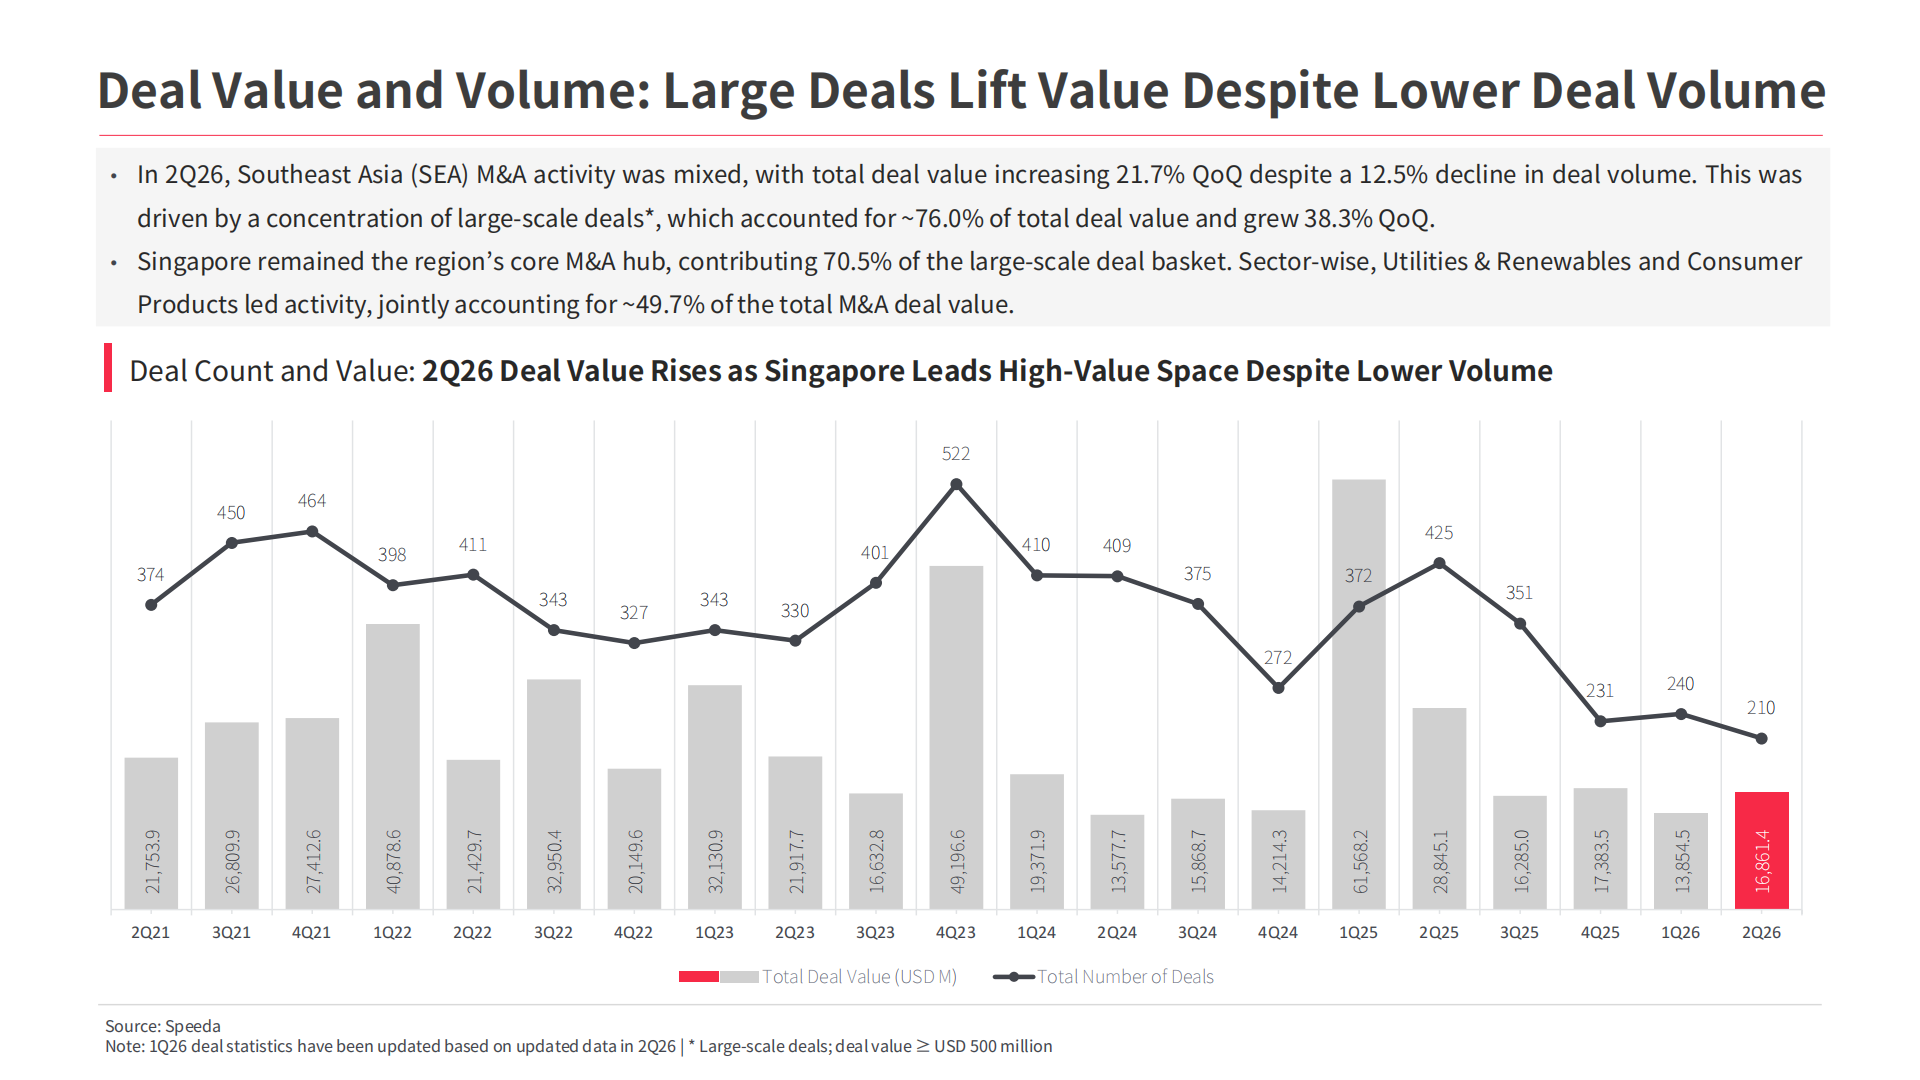
Southeast Asia’s M&A market delivered a mixed picture in 2Q2026. Total deal value increased 21.7% QoQ to approximately USD 16.9 billion, even as deal volume declined 12.5% to 210 transactions.
The headline numbers, however, only tell part of the story.
The increase in value was driven by a relatively small number of large transactions, while cross-border activity continued to account for a significant share of the market. At the sector level, capital also became increasingly concentrated in a few areas, including Utilities & Renewables, Consumer Products and Agriculture.
For investors and M&A advisors tracking Southeast Asia, the more relevant question is not simply whether deal activity increased or declined, but where capital is moving and which transactions are driving the change.
Here are three developments from Speeda’s 2Q2026 Southeast Asia M&A data worth watching
Deal value increased — but a small number of transactions drove the growth
The concentration of value was particularly notable: the top five transactions accounted for approximately 60.6% of total deal value, compared with 46.6% in 1Q2026. Large-scale transactions valued at USD 500 million or more accounted for approximately 76% of total deal value.
This concentration was reflected in several of the quarter’s largest transactions, including Sembcorp’s approximately USD 4.6 billion acquisition of Pioneer Sail Holdings and Latrobe Valley Power Holdings, Olam Group’s approximately USD 1.8 billion sale of a stake in Olam Agri, and Flex’s USD 1.1 billion acquisition of Electrical Power Products.
The implication for deal teams: aggregate deal volume may give an incomplete picture of where M&A momentum is actually building. Looking at the transactions behind the headline numbers provides a clearer view of which assets, sectors and strategic themes are attracting capital.
What the full report adds: the complete Top 10 SEA M&A deals, transaction-level details, target and buyer information, deal values, and country and sector breakdowns.
Cross-border transactions continued to shape Southeast Asia’s M&A market
Cross-border transactions accounted for approximately 56.9% of total SEA M&A deal value in 2Q2026, while inter-regional transactions accounted for the remaining 43.1%.
More importantly, the value and volume of transactions tell different stories.
Outbound deals represented only around 10.5% of total deal volume, but accounted for 37.8% of deal value. The average outbound transaction was approximately USD 289 million—around 6.2 times the average value of inter-regional deals and three times that of inbound transactions.
Singapore was a major contributor to this trend. The country accounted for approximately 62.1% of total SEA M&A deal value, with outbound transactions representing 58.1% of Singapore’s deal value.
For investors and advisors, this makes the direction of capital an important lens alongside deal volume. A country generating fewer transactions can still have an outsized impact on regional M&A if its transactions are larger or increasingly cross-border.
What the full report adds: a detailed breakdown of inter-regional, inbound and outbound activity, country-level deal value, and the transactions behind the region’s cross-border flows.
Capital is concentrating around structural growth themes
The sector mix also shifted significantly in 2Q2026.
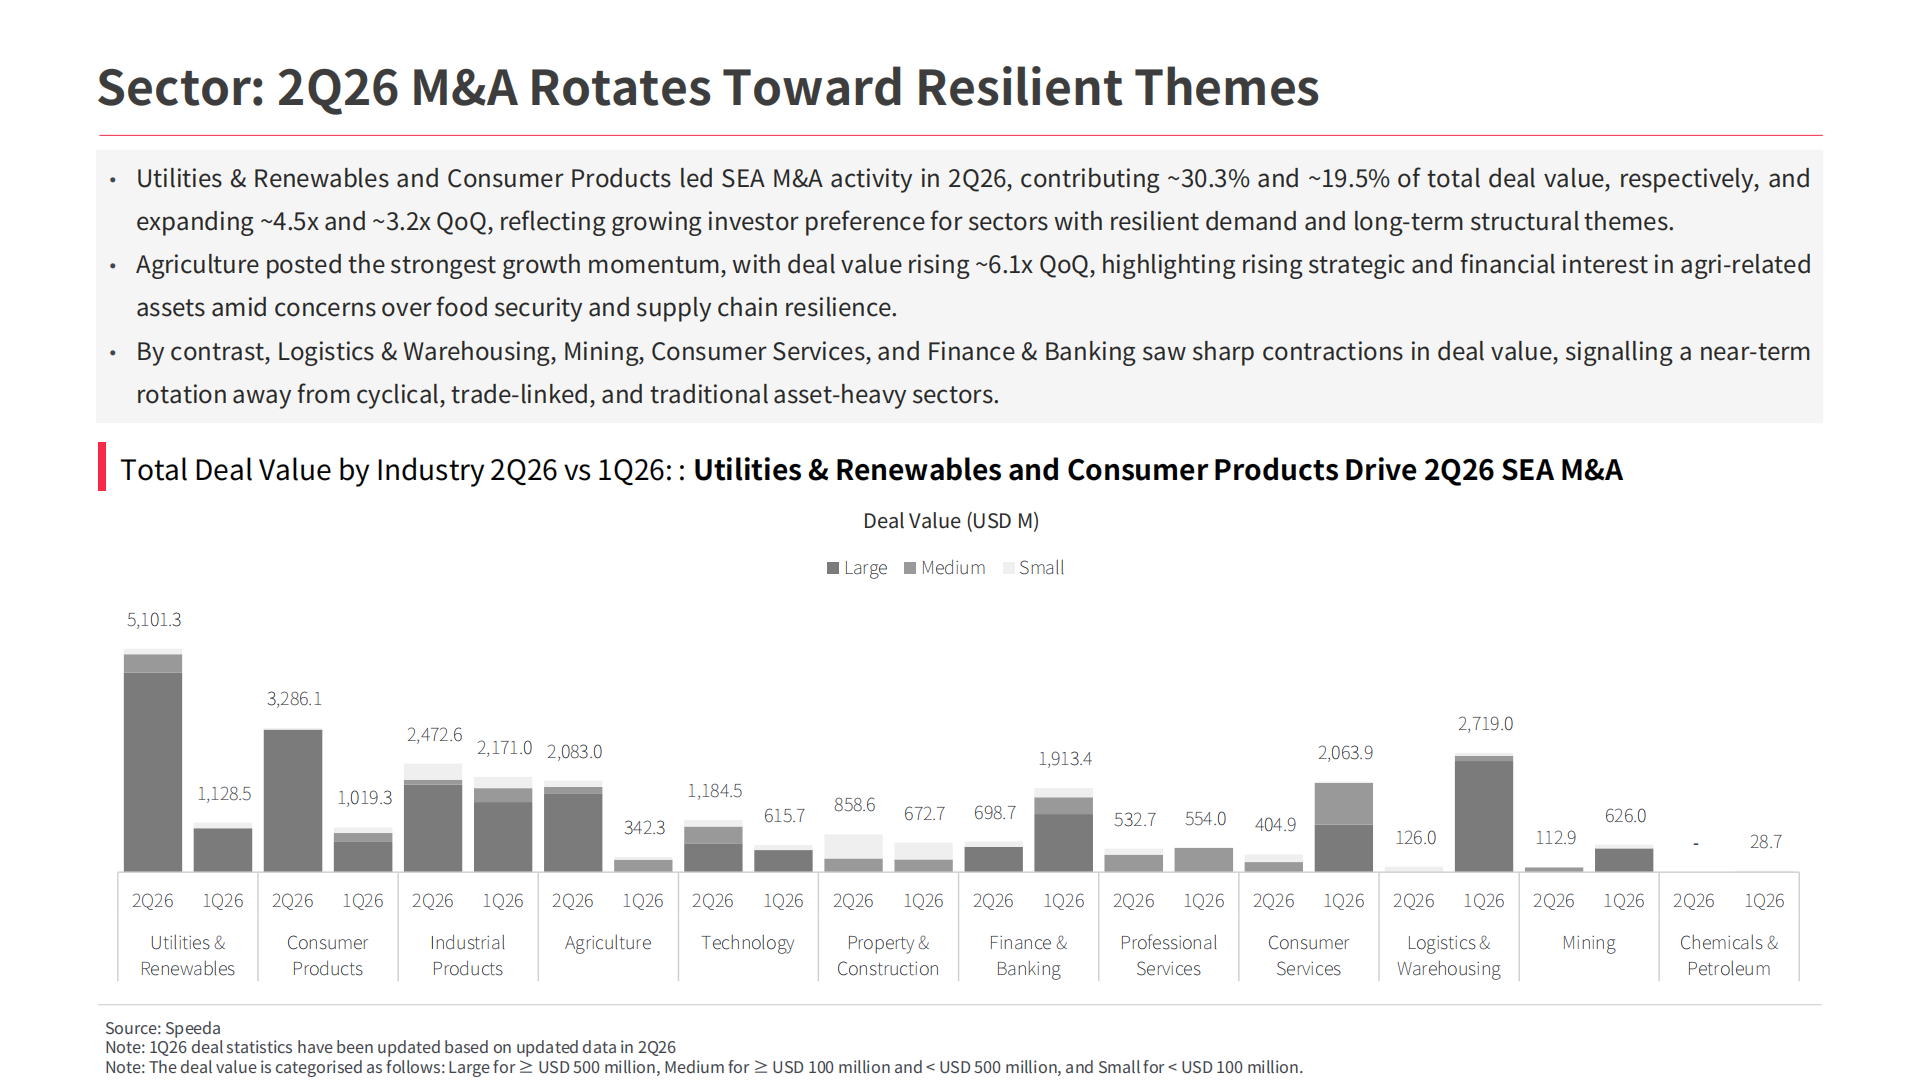
Utilities & Renewables accounted for approximately 30.3% of total SEA M&A deal value, while Consumer Products contributed another 19.5%. Their respective deal values increased approximately 4.5x and 3.2x QoQ. Agriculture recorded the strongest growth, with deal value increasing roughly 6.1x QoQ.
Several transactions illustrate the themes behind these numbers.
Sembcorp’s acquisition of Australian power assets expanded its exposure to electricity and gas infrastructure, while Flex and BizLink’s transactions increased exposure to power distribution and components supporting the AI data-centre ecosystem. Olam Group’s stake sale in Olam Agri also highlighted strategic interest in scaled agribusiness platforms linked to food security and supply-chain resilience.
At the same time, several traditionally active sectors saw deal value contract sharply, including Logistics & Warehousing, Mining, Consumer Services, and Finance & Banking.
For deal teams, the sector-level picture is therefore more useful when combined with the individual transactions driving it. The question is not simply which sectors grew, but which assets and strategic themes are attracting the largest commitments of capital.
What the full report adds: sector-level deal value and transaction trends, median deal values and multiples, country-sector comparisons, and detailed transaction examples.
What these shifts mean for deal teams
The 2Q2026 data points to a market where large transactions, cross-border capital and specific structural themes are having an outsized influence on overall M&A activity.
For PE/VC investors and M&A advisors, the value of the data is therefore in moving from the regional headline to the underlying transactions:
- Which sectors are attracting the largest transactions?
- Which countries are driving regional deal value?
- Where is capital moving across borders?
- Which companies and assets are attracting strategic buyers?
- Which transactions are shaping the competitive landscape?
The full report brings these dimensions together across Southeast Asia, providing a more granular view of the transactions behind the quarterly headline numbers.
What’s inside the full 2Q2026 SEA M&A Report?
Download the report for deeper analysis of:
SEA M&A trends
- Deal value and volume trends
- Large, medium and small transaction mix
- Cross-border and inter-regional deal flows
- 3Q26 M&A outlook
Sector and country analysis
- Deal value by industry
- Median deal value and EV/EBITDA by sector
- Country-level deal activity
- Singapore’s outbound M&A activity
- Country-sector dynamics
Transaction and dealmaker analysis
- Top 10 M&A transactions in Southeast Asia
- Target and buyer information
- Leading financial advisors
- Leading legal advisors
Startup M&A
- Startup M&A by country and sector
- Funding mix
- Funding stage
- Key technology and advanced technology transactions
Looking beyond announced transactions?
For investors and advisors, understanding the M&A landscape often requires going beyond transaction announcements to research the private companies, industries and markets behind them.
Speeda provides largest coverage of private companies across Asia, helping deal professionals conduct company research, compare industries and investigate potential targets alongside broader market and M&A analysis.
Download the full Speeda SEA M&A Report 2Q2026 to explore the data and transactions behind the quarter’s activity.
Thank you for your submission!
We will send an email with the download link to access the report shortly.

 spasia_lm@uzabase.com
 Follow our Linkedin Page !

Our latest updates on
ASEAN reports and webinars are posted here.
- Recommended Content









Thank you for your submission!
We will send a follow-up email shortly. Please check your inbox.
spasia_lm@uzabase.com Follow our Linkedin Page !
Our latest updates on
ASEAN reports and webinars are posted here.